Stop Loss Strategies: Your Gateway to Trading Career
Knowing how to set stop losses is essential when trading on TP Market Trades. A stop loss protects your account from significant drawdowns when a trade goes wrong or when you experience a losing streak. It is one of the best risk management techniques because it ensures you never lose too much of your trading capital.
Therefore, it allows traders to survive in the market and grow their accounts. This article will focus on the different ways you can place a stop loss and increase your chances of success as a trader.
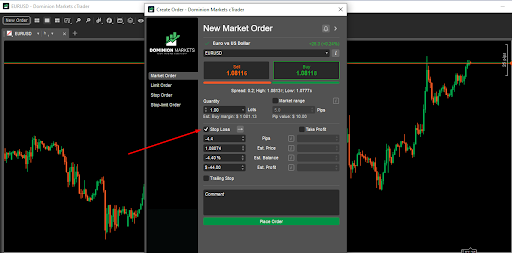
Stop loss order
BEST STOP LOSS STRATEGIES FOR BEGINNER
Several stop-loss strategies are available to all kinds of traders. However, as a beginner, it is better to stick to the more basic and simple strategies. These include the percentage stop and the chart stop.
PERCENTAGE STOP LOSS
With the percentage stop loss strategy, you place your stop loss orders depending on how much of your capital you are willing to lose. Therefore, you use a percentage of your account balance to calculate the stop.
For instance, you can decide to risk only 1% of your total capital for every trade you take. Meanwhile, a more aggressive trader could be willing to lose 6% or more of their total capital.
This strategy is the most basic and straightforward way to ensure you can live to trade another day. Moreover, it is best suited for inexperienced traders who are still learning their way around the charts,
CHART STOP LOSS
When you take the next step and become better at analyzing charts, you can move to the chart-stop-loss strategy. You place your stop loss here depending on what the charts tell you. For instance, you can use support and resistance, trendlines or even indicators.
Therefore, if you are using support and resistance, you can place your stop loss above the previous resistance or below the previous support.
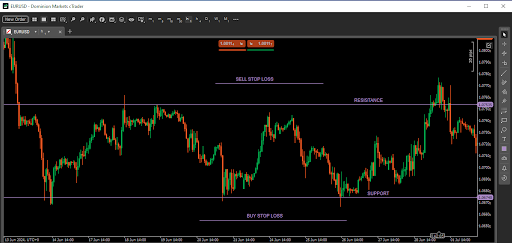
Range support and resistance stop loss
The chart above shows where a range trader can place their stops. You can quickly identify the best areas to place your stop by drawing clear support and resistance lines. Place your stop a few pips away from the support line for a buy position. Meanwhile, for the sell position, place it a few pips above the resistance line.
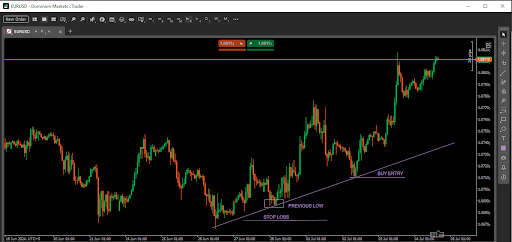
Trend support and resistance stop loss
The chart above shows an example of a trend trade. In the above case, you can enter a long position in a solid bullish trend and place your stop loss a few pips below the previous low, which is a support level.
RISK MANAGEMENT STRATEGIES IN TRADING
A stop loss is one of the best risk management strategies because it protects your account from significant losses. There are two ways you can place a stop loss as you trade. You can do it manually or use an automated stop loss.
AUTOMATED STOP-LOSS METHODS
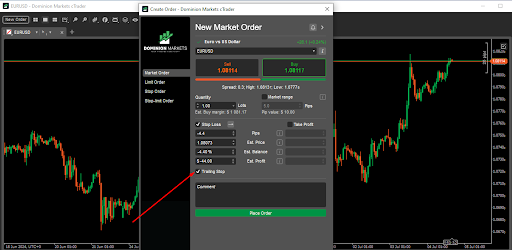
Trailing stop loss
An automated stop loss will calculate your risk depending on the figures you input and move the stop loss as the price changes. One good example of this is the trailing stop loss. Here, you can choose this option and place your risk in points or pips before or after you place your trade.
After manually placing the first stop loss, you can sit back and watch as the stop loss moves with the price. The trailing stop will move only if the trade is winning. However, if it goes wrong, the initial stop loss will pause until the price gets to it or reverses.
FINANCIAL MARKETS
There are many risk management techniques in the financial markets. Apart from protecting your initial capital with a stop loss, you can also protect your wins with take profits.
STOP LOSS VS TAKE PROFIT STRATEGIES
Stop-loss strategies focus on what happens when you lose a trade. On the other hand, take-profit strategies focus on what happens when you win a trade. Therefore, the stop loss focuses on the risk while the take profit focuses on the reward.
You can place your take profit targets the same way as you place your stop losses. For example, you can decide to use a percentage. You can choose to close a trade when you have made 2% of your account balance. You can also use the charts to determine where to place your take profit with support and resistance or indicators.
EXAMPLE OF A STOP LOSS ORDER
Below is an example of a stop-loss order. After a strong bullish trend, the price reverses and breaks below its bullish trendline. This is an excellent opportunity to sell, with the stop loss above the previous high, as shown in the chart below.
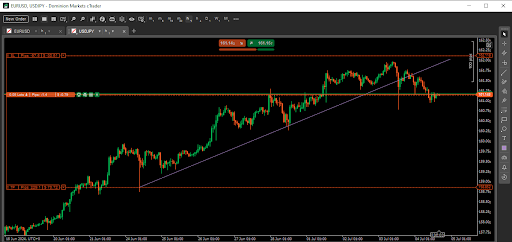
Sample trade
A closer look at the stop loss order reveals more details.

Stop loss details
The stop loss is set 97.5 pips away from the current price. Therefore, there is a chance the trade will result in a loss of $30.24. With an account balance of $999, this trade risks about 3% of the total capital. Therefore, if the price continues to rise and hits the stop loss order, you will end up with a 3% loss in your account value.
SETTING STOP LOSS FOR VOLATILE MARKETS
A volatility stop loss focuses on how much a market moves in a specific period. Some markets are pretty volatile, while others are calm. When placing a stop loss in a volatile market, first calculate the volatility in the timeframe you are trading. Manually calculating volatility means taking the size of a specific number of candles and finding the average range.
For instance, you can look at the last twenty candles in the daily timeframe. Add the pip size of all these candles and divide them by twenty to find the average daily range. If a stock moves an average of 100 pips daily, you can use a multiple of this to place your stop loss. Therefore, you will not be prematurely taken out due to the market noise during the day.
ADVANCED STOP-LOSS STRATEGIES FOR EXPERIENCED TRADERS
Experience traders spend a lot of time deciding where and how to place their stop losses. Moreover, they often use additional tools like indicators to determine the best areas for a stop loss. An example of an advanced stop loss strategy is the Bollinger Band volatility stop loss.
BOLLINGER BAND VOLATILITY STOP
Here, traders use the Bollinger Bands indicator to read the price volatility and place stops accordingly. This strategy is best suited for range traders. The gap between the upper and lower bands shows the volatility of an asset. Therefore, you can place your stop above or below these levels, as shown below.

Bollinger Band volatility stop
Place your stop loss below the lower band for a buy order and above the upper band for a sell order.
Join TP Market Trades today and use stop losses to manage risk and ensure you survive and thrive in the markets.
