Real-Time Insights: A Comprehensive Analysis of cTrader Vs Metatrader 5
To make well-informed decisions when analyzing the market, traders need real-time data. It helps you track emerging patterns, price movements, and market sentiment, which are all important in trading. Below, we will look at an in-depth analysis of cTrader vs MetaTrader 5 based on real-time insights. This will help you make the right choice when choosing the platform to use.
REAL-TIME INSIGHTS ON cTRADER
TP Market Trades gives you the cTrader platform, where you can get up-to-date trading information. The cTrader platform allows you to trade with the latest data displayed in many ways, as shown below.
PRICE CHARTS
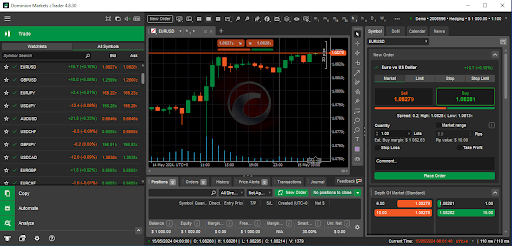
The first thing traders need to analyze the markets is an up-to-date chart showing the price changes as they happen. The chart is at the center of your workspace on the cTrader platform. You can pick among nine different chart types to analyze the market. Here, you can quickly identify patterns and trends as they happen so that your trading choices are based on current market conditions.
cTrader workspace
The real-time price data is displayed on the left side of the workspace. Here, you can see the percentage change of a specific asset. Moreover, you can see the bid and ask prices.
PRICE STATISTICS
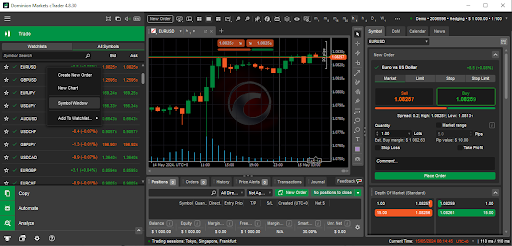
However, to understand what is happening for each asset, right-click the symbol and go to the symbol window as shown below.
cTrader symbol window
Above, we have chosen to look at the EUR/USD currency pair. After clicking on the symbol window, you will get a smaller window showing more statistics on the pair. Here, you can analyze real-time price data to make informed trading decisions.
cEUR/USD
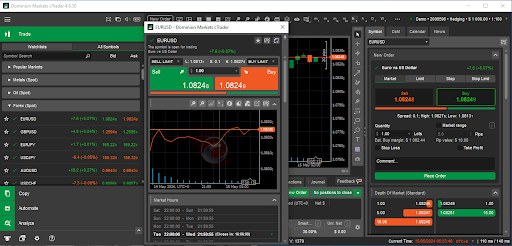
For the EUR/USD pair, at the very top of the window, you can see the currency’s symbol. After that, you see whether the currency is open for trading. From there, you get more price details, including the selling and buying prices. Moreover, it shows the daily low, the lowest point the price has reached during the day, and the daily high, the highest point the price has reached during the day. The spread is the difference in the buying and selling prices, which will be your cost for trading.
Below that is a line chart showing the buy and sell prices as they change. This gives you a closer view of what the price is doing.
DEPTH OF MARKET

When you scroll lower on the symbol window, you will get to the Depth of Market. You can also see this on the right side of your workspace. The Depth of Market allows you to analyze the liquidity of the market. It shows you whether big orders can move the price. A deep market has a lot of traders willing to buy and sell. Therefore, the spread and volatility are relatively low. On the other hand, a shallow one has few buyers and sellers. This increases the spread and volatility.
INVERTED RATE
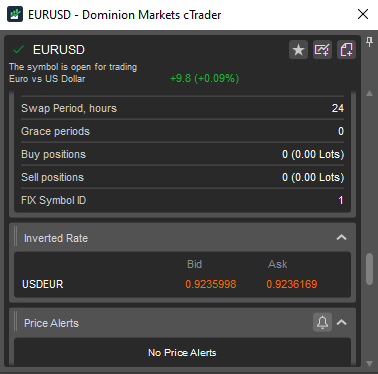
EUR/USD inverted price
After this, you can see the inverted rate for EUR/USD, which is USD/EUR. Here, you can check the bid, the highest price at which you can buy the pair, and the ask, the lowest price at which you can sell it.
REAL-TIME INSIGHTS ON METATRADER 5
On the MetaTrader 5 platform, you can get real-time data on the Market Watch window on the left side of your workspace. At the same time, you get your charts on the right side, where you can draw patterns and analyse the most recent price changes.
SYMBOL WINDOW
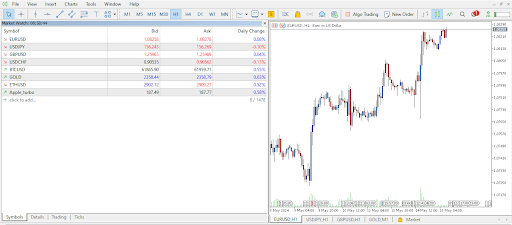
Symbol window
The first window shows the symbols of the asset, the bid and the ask prices, and the daily percentage change of each asset. Here, you can see the highest prices buyers are willing to pay for each asset and the lowest prices sellers are willing to sell the assets. Meanwhile, the percentage daily change shows how much the asset has moved during the day.
DETAILS WINDOW
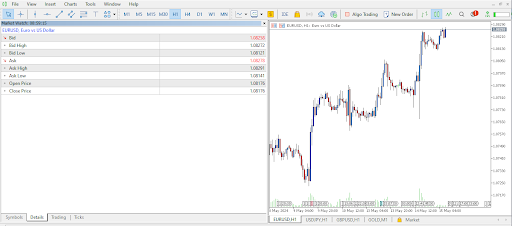
Details window
In the details window, you get more statistics on the bid and ask prices of the chosen asset. Above, we are looking at the EUR/USD pair. For the bid, you can view the high and the low for the day. Similarly, you can view the ask high and the ask low. Finally, you can see the price at which EUR/USD opened the day and closed the previous day.
TRADING WINDOW
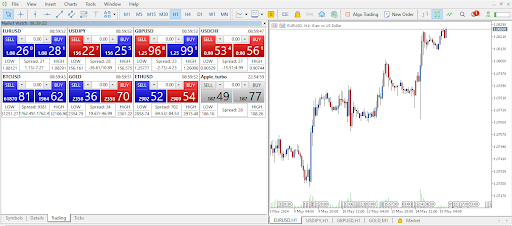
Trading window
The next window shows you trading details. Here, you get the selling and buying prices, the highs and lows of each asset, the spread and the swap. The spread shows the difference between the bid and ask prices, representing your trading cost. Moreover, from this window, you can see the swap. This shows you the interest you pay or earn for a trade you keep open overnight.
TICKS WINDOW
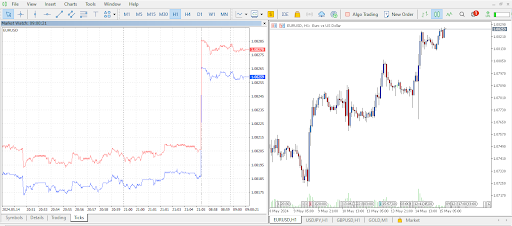
Ticks window
The ticks window gives you a closer view of price movement as data enters. Moreover, here, you can see the changes in the bid and ask prices and the spread, represented on a chart.
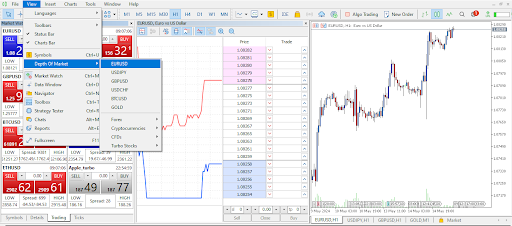
Depth of Market
Finally, to get to the Depth of Market on MT5, click on the view option, then Depth of Market and decide which asset you want to see. In the above chart, you can see the DoM for EUR/USD.
IMPORTANCE OF REAL-TIME DATA AND ANALYTICS IN TRADING
Real-time data plays a significant role in successful trading. Below are some of the benefits of having up-to-date analytics in trading.
INFORMED DECISION-MAKING
To make well-informed decisions while trading, you need to be able to analyze current market conditions. This way, you can easily track emerging patterns and trends. Moreover, you get a clear picture of the currency market sentiment, allowing you to decide when to buy or sell.
REDUCED LATENCY
TP Market Trades is known for offering traders very low latency. This is because you get real-time data, make quick decisions, place orders, and wait for execution. Therefore, there is a higher chance that you will get the price displayed on your platform before the market moves. This can only happen when you get up-to-date price quotes.
ENHANCED RISK MANAGEMENT
With real-time data, you can see growing risks of reversal in a trend as it happens. This way, you can decide quickly when to exit and lock in profits or reduce further losses. Risk management is essential to trading, and real-time data improves your response to market changes.
COMPETITIVE EDGE
The more recent your price quotes and trading data, the better your chances of being ahead of your competitors. Real-time data allows you to see and join trends the moment they start and exit the moment they reverse. This gives you a competitive edge over traders with delayed data and analytics.
There are many benefits to real-time data in trading. Join TP Market Trades and experience the advantages of getting the latest price quotes and low latency.
